Interactive Dashboard
Explore the data
The GCHD dashboard lets you visualise hazard layers, query children's exposure by country or sub-national unit, and ask natural language questions via AI (under development).
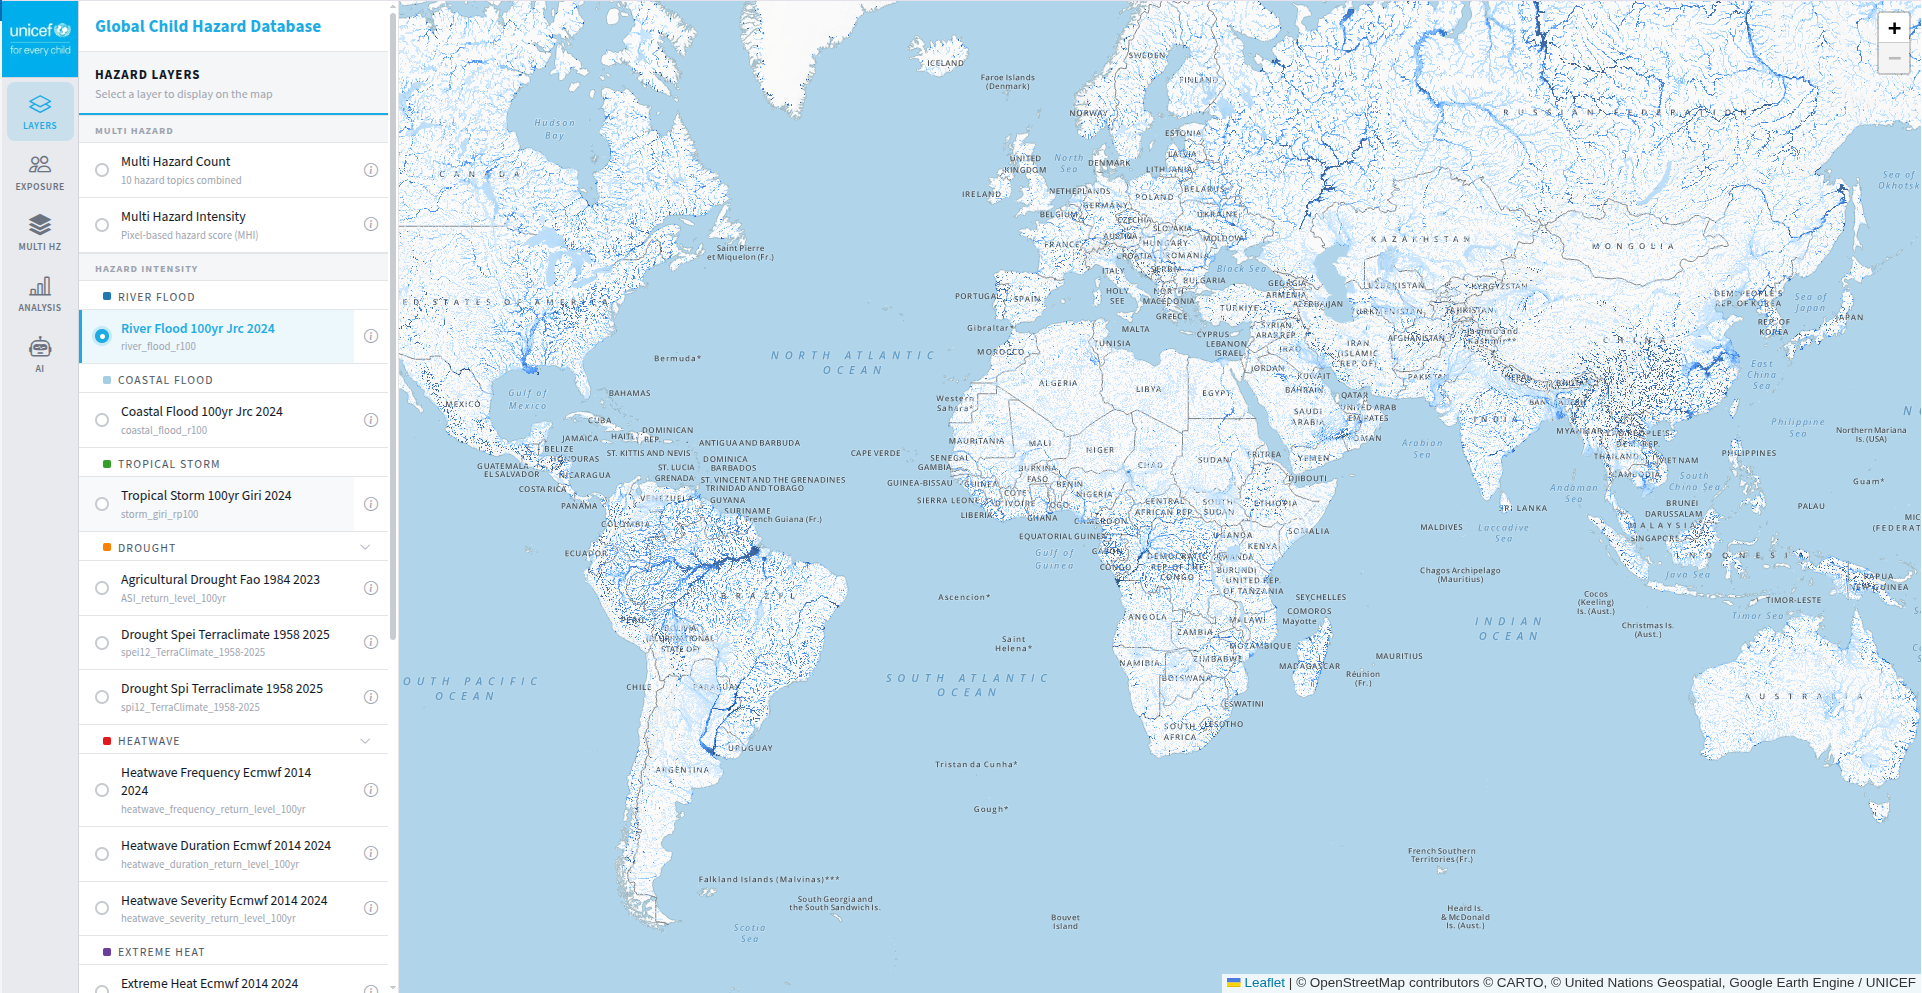
GCHD is UNICEF's open database of children's exposure to climate, geophysical, and conflict hazards worldwide. Globally consistent. Spatially explicit. Built for action.
Each hazard layer is sourced from a globally recognised dataset, processed to a standardised spatial resolution, and linked to children's population estimates to produce exposure counts at country and sub-national levels.
JRC 100-year return period inundation extent
JRC 100-year return period coastal inundation
GIRI 100-year return period wind speed
FAO ASIS return level — crop stress frequency
TerraClimate SPI-12 & SPEI-12 — water deficit
ERA5 — frequency, duration & severity of heatwave events
ERA5 — cumulative degree-days above 35°C
NASA FIRMS — fire frequency & radiative power (90th pct)
Satellite PM2.5 — 90th percentile, 1998–2023
UNCCD — dust storm occurrence frequency
MAP — Pf & Pv prevalence, 2013–2022 average
GEM — probabilistic peak ground acceleration
GVM / Smithsonian — volcanic hazard zones
NASA / UNDRR — landslide susceptibility
ACLED / UCDP — conflict event density
A four-stage pipeline transforms raw hazard datasets into globally comparable children's exposure estimates at country and sub-national levels.
Individual hazard datasets are downloaded from authoritative global sources and uploaded to cloud data storage (Azure and GEE) as standardised raster assets.
Two composite indicators are derived: the Multi-Hazard Count (MHC), which counts the number of distinct hazard categories a location is exposed to, and the Multi-Hazard Intensity (MHI), a continuous 0–10 score capturing combined hazard severity using a PCA-based synthetic approach.
Hazard layers are overlaid with WorldPop gridded children's population (2025) then aggregated into various administrative regions including country (Admin 0), regional (Admin 1) and district (Admin 2).
Exposure results are formatted and served through the interactive GCHD dashboard, UNICEF Data Warehouse, and UNICEF's GeoSight platform.
Counts the number of distinct hazard categories a location is exposed to (max 8). Identifies hotspots where children face simultaneous hazards.
Continuous 0–10 composite score using a PCA-based synthetic approach across 13 hazard layers. Distinguishes frequent mild events from rare catastrophic events.
The GCHD dashboard lets you visualise hazard layers, query children's exposure by country or sub-national unit, and ask natural language questions via AI (under development).